San Diego County Home Market Normalized, Prices Softened in July

Summary of the state and trends of the residential real estate market in San Diego as of July 2024:
Overall, the San Diego residential real estate market in July 2024 shows signs of normalization after a period of intense activity. While prices remain high and continue to show year-over-year growth, the pace of increase has slowed. The market is becoming more balanced with increasing inventory and longer selling times, potentially offering more opportunities for buyers compared to the previous year.
- The median sale price in San Diego County was $950,000 in June 2024, up 9.2% year-over-year (Redfin).
- Zillow reports a slightly higher median sale price of $961,667 for June 2024.
- The California Association of Realtors (CAR) reports a median price of $1.02 million in July 2024, which is a 5.3% increase from July 2023 but a 3.2% decrease from June 2024.
2. Inventory and Listings:
- Active listing count increased significantly by 77.7% year-over-year (Realtor.com).
- New listings increased by 14.5% compared to last year (Realtor.com).
- Zillow reports 2,537 homes for sale and 1,123 new listings as of July 31, 2024.
3. Days on Market:
- Homes spent an average of 33 days on the market, 2 days more than last year (Realtor.com).
- Redfin reports an average of 17 days on market in June 2024, up from 12 days last year.
- Zillow indicates a median of 13 days to pending as of July 31, 2024.
4. Sales Volume:
- 2,045 homes were sold in June 2024, down from 2,145 in the previous year (Redfin).
5. Price Trends:
- 51.9% of sales were over list price, while 36.8% were under list price (Zillow, June 2024).
- The median sale to list ratio was 1.002, indicating homes typically sold for slightly above asking price (Zillow).
6. Market Dynamics:
- The share of listings with price cuts increased by 8.6 percentage points year-over-year to 19.1% (Realtor.com).
- The market is showing signs of cooling, with homes spending more time on the market and an increase in inventory.
7. Regional Comparison:
- San Diego's market appears to be more active than many other markets, with significant increases in inventory and new listings compared to national trends.
July 2024 Monthly Housing Market Trends Report
- The number of homes actively for sale was notably higher compared with last year, growing by 36.6%, a ninth straight month of growth, and now sits at a post-pandemic high.
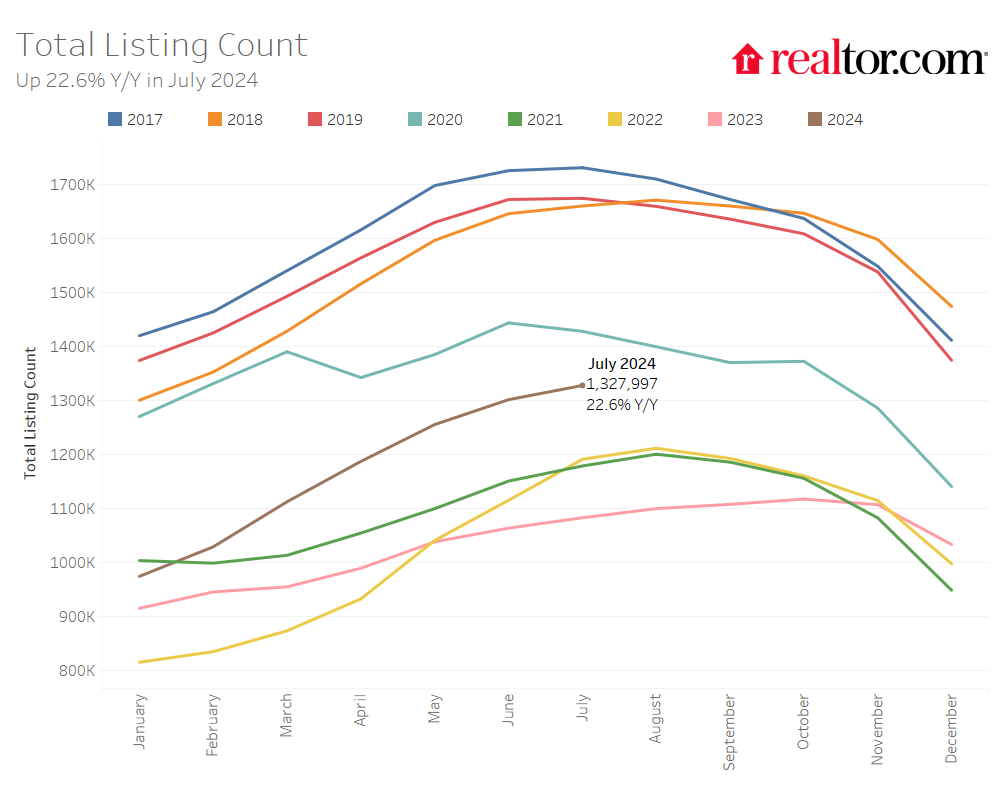
- The total number of unsold homes, including homes that are under contract, increased by 22.6% compared with last year.
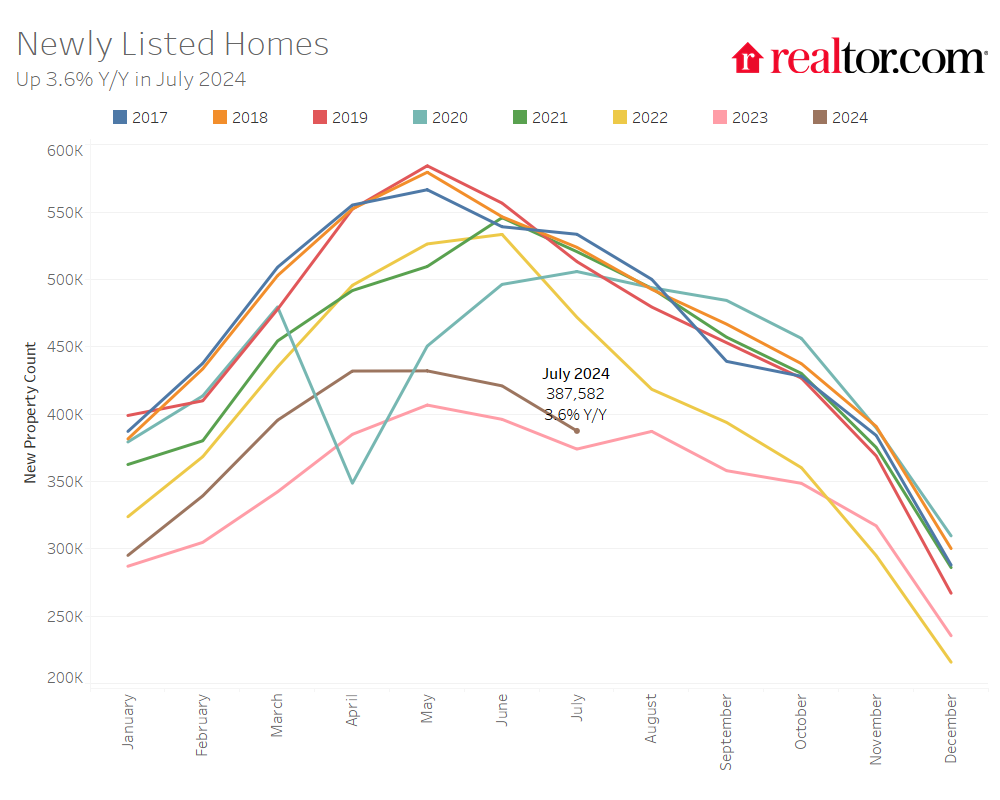
- Home sellers were more active this July, with 3.6% more homes newly listed on the market compared with last year, but this is lower than June.
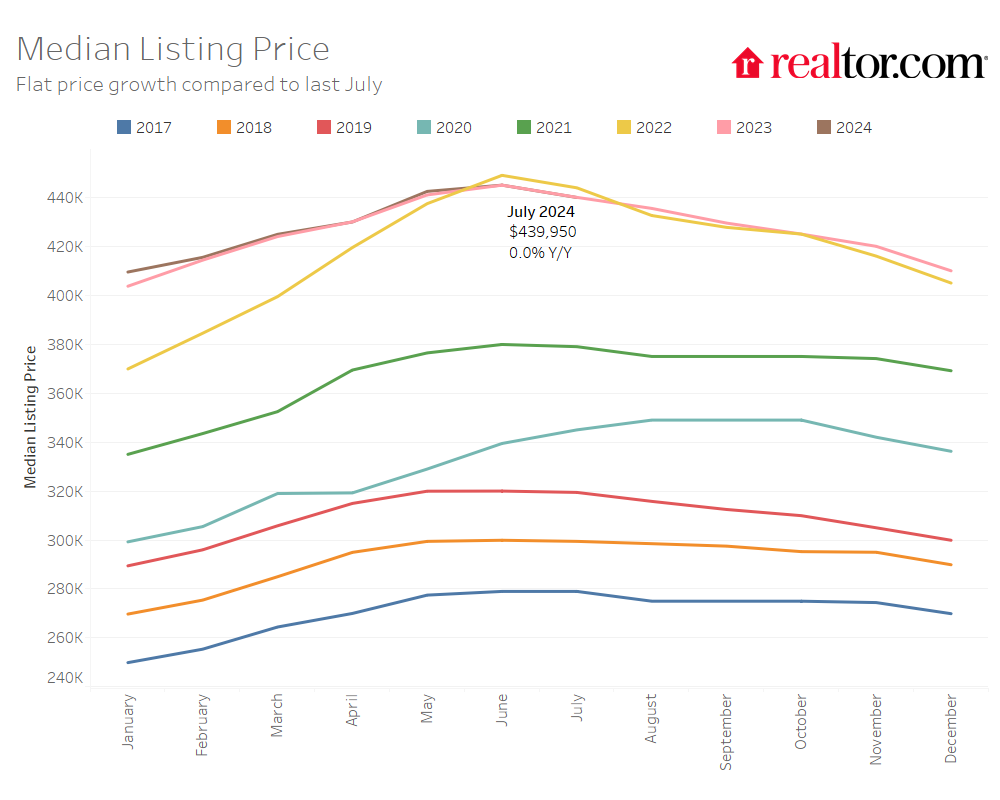
- The median price of homes for sale this July remained stable compared with last year, at $439,950, however, the median price per square foot grew by 3.1%, indicating that the inventory of smaller and more affordable homes has grown in share.
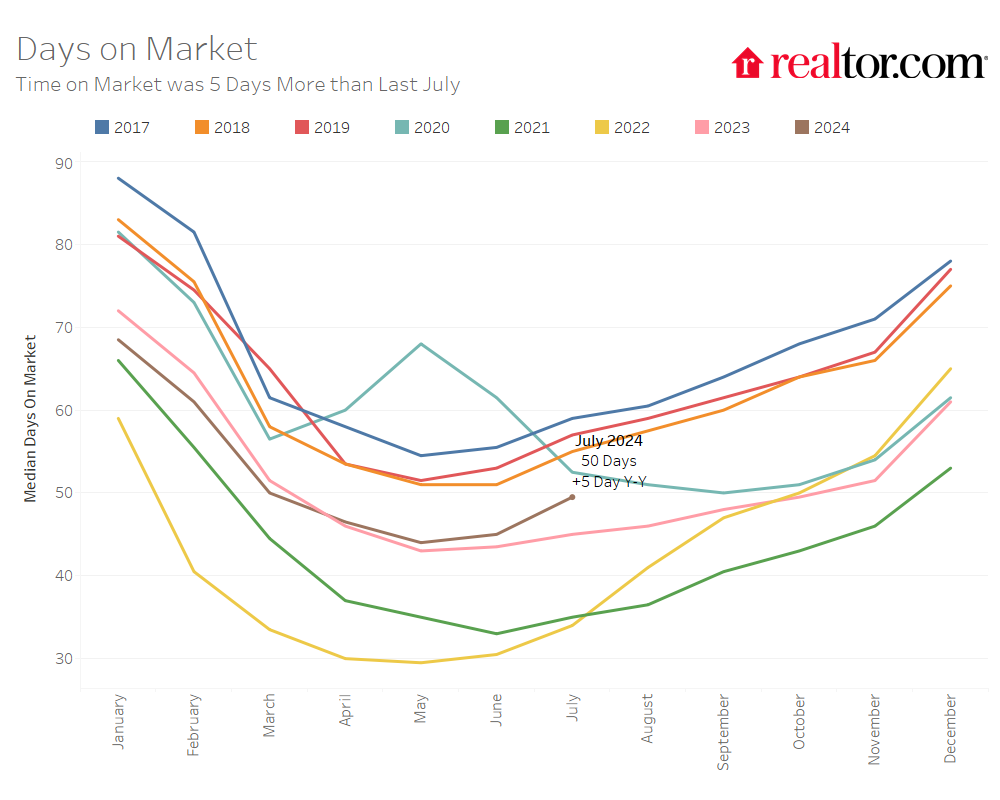
- Homes spent 50 days on the market, the most for a July since 2020. This is five days more than last year and five more days than last month.
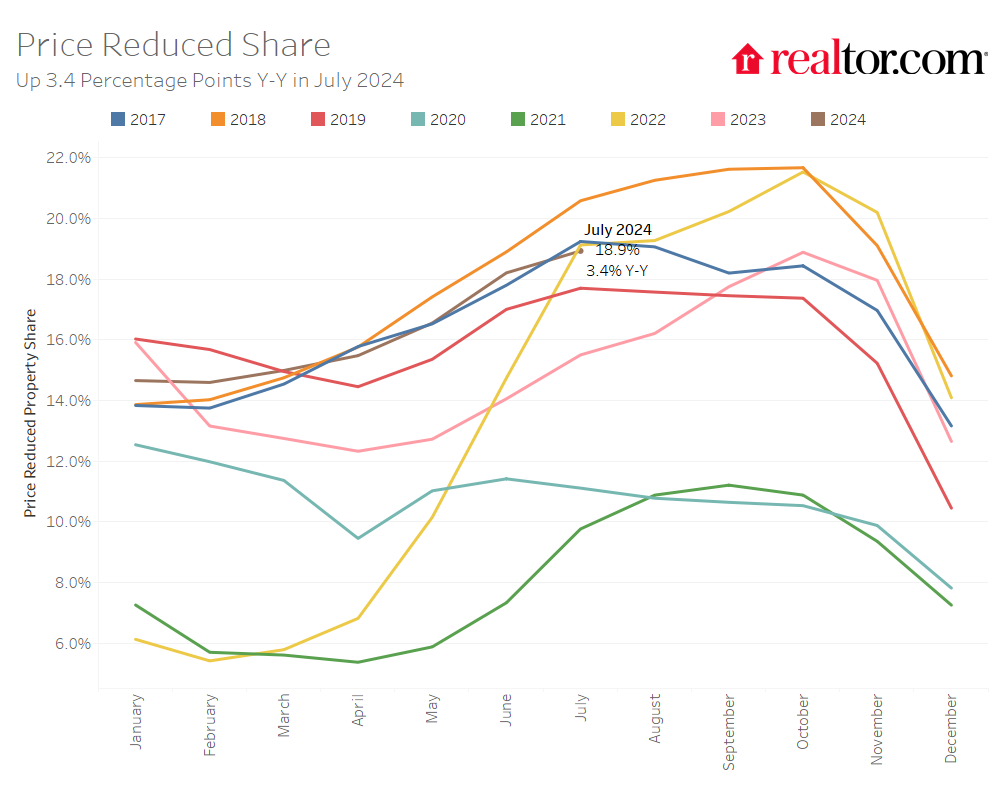
- The share of listings with price cuts has reached a two-year high, increasing by 3.4 percentage points compared to last year to 18.9%. It is also now higher than pre-pandemic levels.
According to the Realtor.com® July housing data, the market cooled considerably as the housing market began to exit the peak buying season and expectations for mortgage rate reductions rose. While the median list price nationwide stayed the same as last year, homes continue to see a modest price increase on per square foot basis. Meanwhile, sellers are becoming more grounded with patience and price expectations, with homes moving at the slowest rate since 2020, the share of listings with price cuts reaching the highest since 2022, and active listing counts hitting a post-pandemic high.
The number of homes for sale continues to accumulate, but it is still not back to pre-pandemic norms
There were 36.6% more homes actively for sale on a typical day in July compared with the same time in 2023, marking the ninth consecutive month of annual inventory growth and the highest count post-pandemic. This is a slight moderation from June, which was up 36.7% year-over-year. While inventory this July is much improved compared with the previous three years, it is still down 30.6% compared with typical 2017 to 2019 levels. This is a continued improvement from last month’s 31.2% gap, as inventory continues to accumulate on the market.
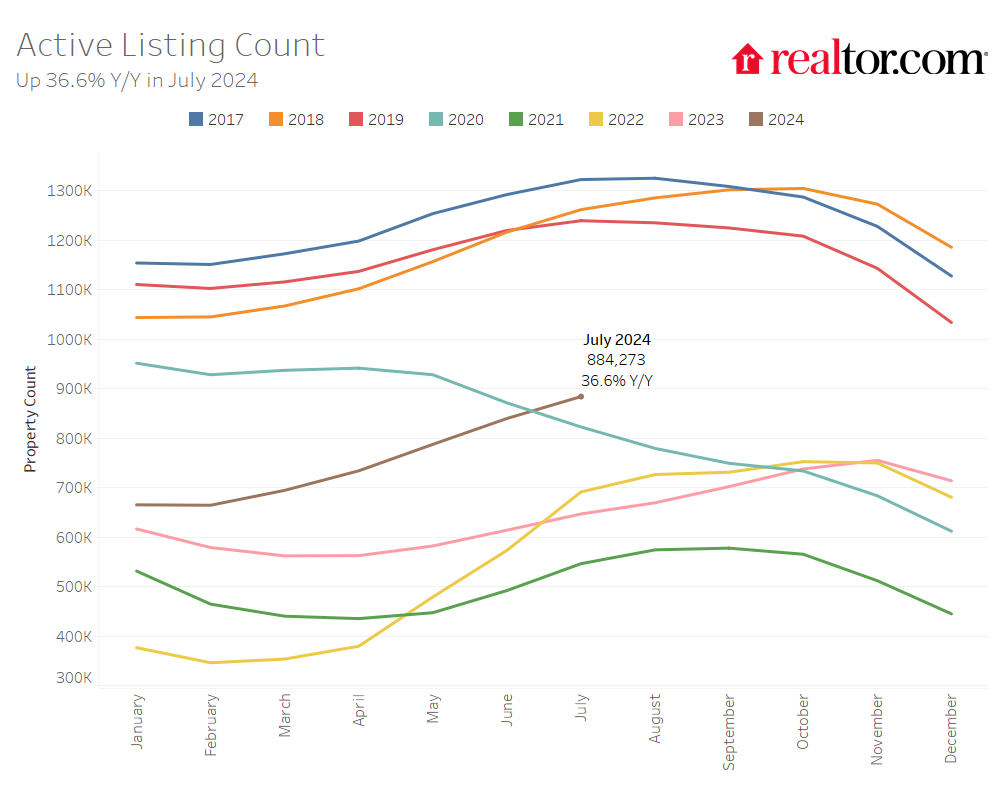
In July, as in the previous five months, the growth in homes priced in the $200,000 to $350,000 range outpaced all other price categories, as home inventory in this range grew by 47.3% compared with last year. However, this is down from last month’s high 50% growth rate. This increase continues to be driven by a greater availability of smaller and more affordable homes in the South.
The total number of homes for sale, including homes that were under contract but not yet sold, increased by 22.6% compared with last year, growing on an annual basis for the eighth month in a row and eclipsing last month’s rate of 22.4%.
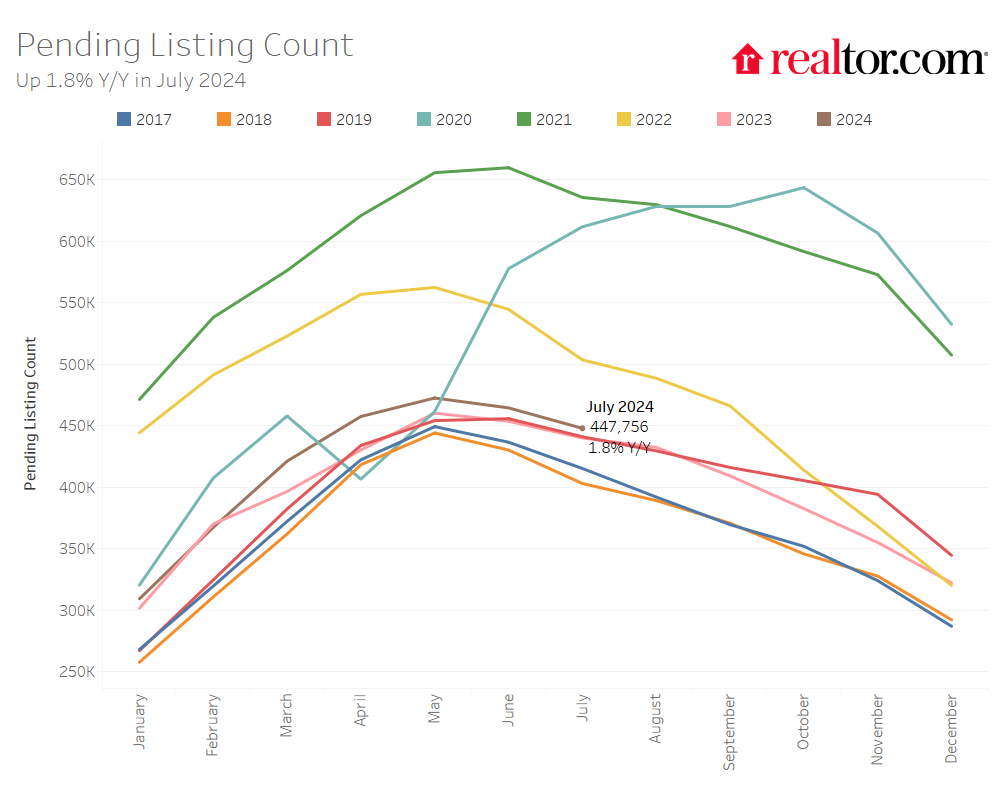
The number of homes under contract but not yet sold (pending listings) increased by 1.8% compared to last year, which is less than last month’s rate of 2.4%. As mortgage rates fell in July to their lowest since March on expectations that the Federal Reserve will cut rates as early as September, we suppose some homebuyers may be holding out for lower rates over the next few months. It’s also important to note that back in April we predicted that the growth in pending listings would slow, and this materialized in both May, June, and July. We think this could be the trend up to the next Fed meeting in September.
Sellers continued to list their homes in higher numbers this July as newly listed homes were 3.6% above last year’s levels but substantially less than June’s figure of 6.3%. This marks the ninth month of increasing listing activity after a 17-month streak of decline. We think the decrease in mortgage rates seen in July likely contributed to an increased pace of growth in listing activity. We expect selling activity to continue to normalize as rates inch their way down over the next year, with potentially an unusual uptick in September if the Fed decides to cut rates.
Regional and Metro Area Inventory Trends
The South and West Are Closest to Bridging the Inventory Gap
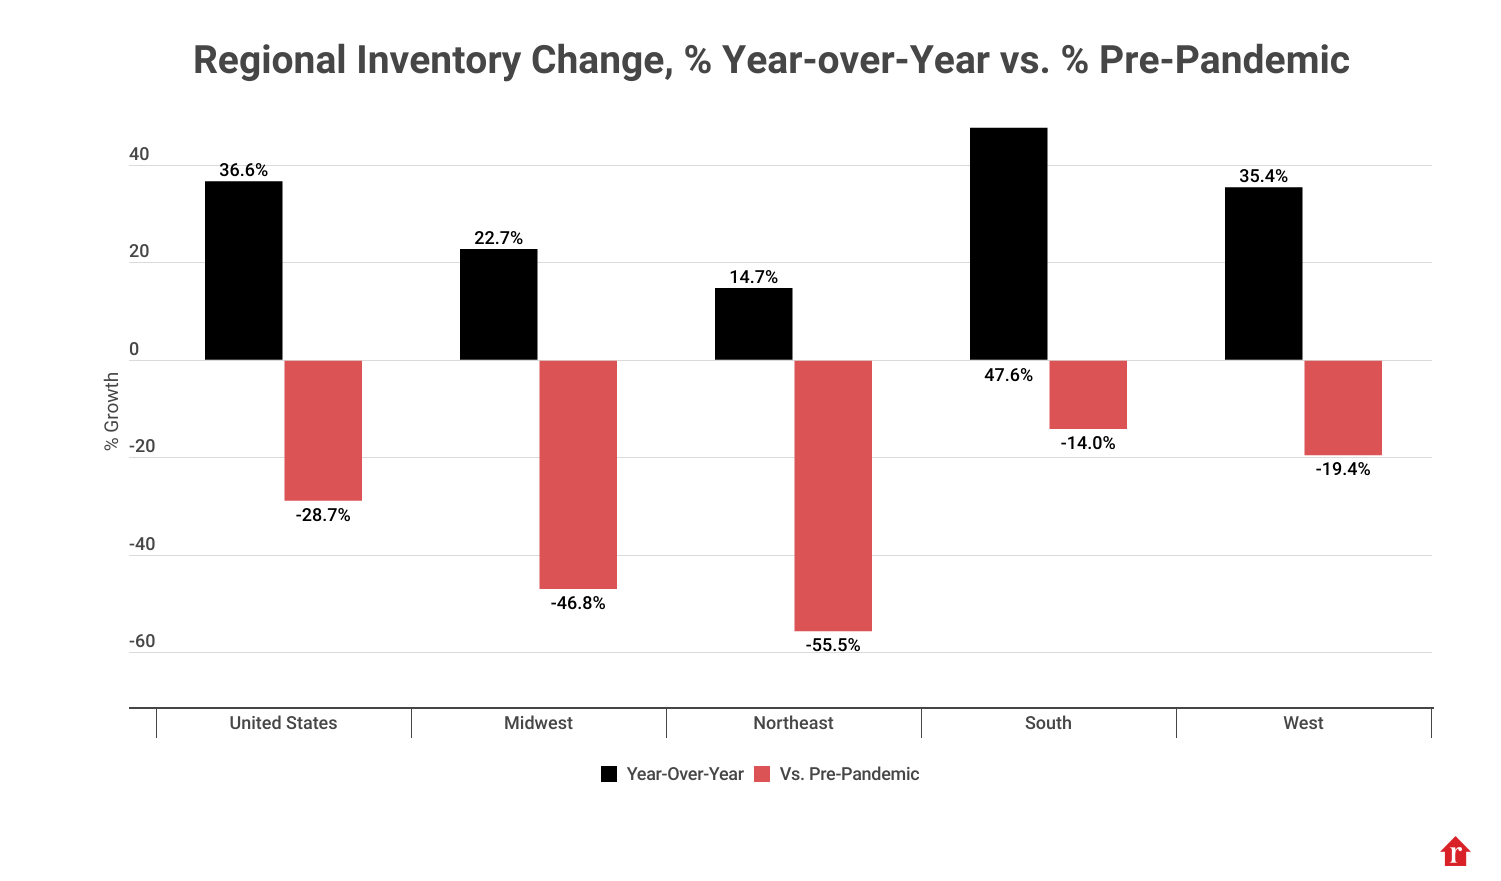
In July, all four regions saw active inventory grow over the previous year. The South saw listings grow by 47.6%, while inventory grew by 35.4% in the West, 22.7% in the Midwest, and 14.7% in the Northeast. Compared with the typical July from 2017 to 2019 before the COVID-19 Pandemic, the South saw the smallest gap in inventory, down 14.0% compared with pre-pandemic levels, while the gap was 19.4% in the West, and much larger in the Midwest and Northeast, at 46.8% and 55.5%, respectively.
The inventory of homes for sale increased in all of the largest 50 metros compared with last year. Metros that saw the most inventory growth included Tampa (+94.9%), Orlando (+78.7%), and San Diego (+77.7%).
Despite higher inventory growth compared with last year, most metros still had a lower level of inventory when compared with pre-pandemic years. Among the 50 largest metro areas, 12 metros saw higher levels of inventory in July compared with typical 2017 to 2019 levels. This is up from eight metros last month. The top metros that saw inventory surpass pre-pandemic levels were predominantly in the South and West and included Austin (+35.5%), San Antonio (+34.3%), and Denver (+26.7%).
The West saw newly listed homes increase the most compared with last year
Compared with July 2023, newly listed home inventory increased the most in the West, by 7.3%, whereas new inventory grew by 3.0% in the Northeast, 0.9% in the Midwest, and fell by -0.5% in the South. The gap in newly listed homes compared with pre-pandemic 2017 to 2019 levels was also the lowest in the South, where newly listed homes were 17.2% below pre-pandemic levels. In comparison, they were down 31.2% in the West, 24.9% in the Midwest, and 30.6% in the Northeast.
In July, 33 of the 50 largest metros saw new listings increase over the previous year, down from 45 last month. However, no large metros saw more newly listed homes this July compared with the typical pace of new listings from June 2017 to 2019. The metros that saw the largest growth in newly listed homes compared with last year included Seattle (+37.3%), San Jose (+30.8%), and Columbus (+17.4%).
Homes are spending more time on the market compared with last year, but less than pre-pandemic levels
The typical home spent 50 days on the market this July, which is five more days more than the same time last year and five more days than last month. July marks the fourth month in a row where homes spent more time on the market compared with the previous year as inventory continues to grow and home sales remain sluggish. However, the time a typical home spends on the market is a week (7 days) less than the average July from 2017 to 2019.
Regional and metro area time on the market trends
In the South, where the growth in home inventory has been the largest, the typical home spent six more days on the market in July compared with last year, while out West homes are staying on the market two days longer. However, in the Midwest homes are staying on the market the same number of days as the same time last year while in the Northeast homes are spending one less day than last year.
While all regions were still seeing time on the market below pre-pandemic levels, in the West, homes are spending only three days less on the market compared with the typical July from 2017 to 2019. Time on the market was nine days less than pre-pandemic levels in the South, 12 days less in the Midwest, and 16 days less in the Northeast.
Meanwhile, time on the market decreased compared with last year in 24 of the 50 largest metro areas this July, down from 26 markets last month. It decreased the most in Buffalo (-13 days), with Providence (-9 days) and Cleveland rounding out the top three (-8 days). Time on the market increased compared with last year in 26 of the 50 largest metros, including Tampa (+13 days), Orlando (+12 days), and Columbus (+11 days). Two markets saw homes spend considerably more time on the market than typical 2017 to 2019 pre-pandemic timing: Austin (+10 days) and Portland (+9 days).
The median list price remained stable compared with last July, but the price per square foot continues to rise
The national median list price showed the first seasonal decline in July falling to $439,950 from $445,000 in June, but the median list price remained stable compared with the same time last year, when it was $440,000. However, when a change in the mix of inventory toward smaller homes is accounted for, the typical home listed this year has increased in asking price compared with last year. The median listing price per square foot increased by 3.1% in July compared with the same time last year. Moreover, the typical listed home price has grown by 37.7% compared with July 2019, while the price per square foot grew by 51.9%.
The percentage of homes with price reductions increased from 15.5% in July of last year to 18.9% this year. However, the overall price reduced share of inventory is still slightly (-0.25 pp) lower than the shares seen between July 2017 to July 2019.
Regional and metro area price trends
In July, listing prices fell slightly on a year-over-year basis in the South (-0.3%), but prices continued to increase in the Northeast (+4.4%), Midwest (1.8%), and just slightly in the West (+0.2%) compared with the same time last year. Controlling for the mix of homes on the market by looking at price-per-square-foot, prices in all regions showed greater growth rates of 2.3% to 6.1%. Among large metros, the median list price in Rochester (+15.6%), Philadelphia (+11.4%), and Cleveland (+11.2%) saw the biggest increases.
Meanwhile, all 50 large metropolitan areas have seen sizable price growth compared with homes listed before the pandemic. Compared with July 2019, the price per square foot growth rate in the largest 50 metros ranged from 24.1% to 81.9%. The markets where sellers saw the greatest increase in price per square foot included the New York metro area (+78.3% vs July 2019), Tampa (+66.1%), and Nashville (+65.6%). Markets which saw the lowest return included New Orleans (+25.5%), San Jose (+25.5%), and San Francisco (+25.9%).
The share of price reductions was up compared with last year in the South (+4.1 percentage points), West (+3.4 percentage points), Midwest (+2.4 percentage points), and Northeast (+1.4 percentage points). Forty-seven of the 50 largest metros saw the share of price reductions increase compared with last July, the same as in June. Tampa saw the greatest increase (+9.7 percentage points), followed by Charlotte (+9.5 percentage points), and Phoenix (+9.4 percentage points).
July 2024 Regional Statistics
| Region | Active Listing Count YoY | New Listing Count YoY | Median Listing Price YoY | Median Listing Price Per SF YoY | Median Days on Market Y-Y (Days) | Price-Reduced Share Y-Y (Percentage Points) |
| Midwest | 22.7% | 0.9% | 1.8% | 3.8% | 0 | 2.4 pp |
| Northeast | 14.7% | 3.0% | 4.4% | 6.1% | -1 | 1.4 pp |
| South | 47.6% | -0.5% | -0.3% | 2.3% | 6 | 4.1 pp |
| West | 35.4% | 7.3% | 0.2% | 4.1% | 2 | 3.4 pp |
July 2024 Regional Statistics vs. Pre-Pandemic 2017–19
| Region | Active Listing Count vs Pre-Pandemic | New Listing Count vs Pre-Pandemic | Median Listing Price vs Pre-Pandemic (July 2019 Only) | Median Listing Price Per SF vs Pre-Pandemic (July 2019 Only) | Median Days on Market vs Pre-Pandemic (Days) | Price-Reduced Share vs Pre-Pandemic (Percentage Points) |
| Midwest | -46.8% | -26.9% | 39.2% | 46.3% | -12 | -2.1 pp |
| Northeast | -55.5% | -30.6% | 51.0% | 63.0% | -16 | -5.6 pp |
| South | -14.0% | -17.2% | 35.3% | 52.8% | -9 | 4.1 pp |
| West | -19.4% | -31.2% | 37.0% | 48.0% | -3 | 1.9 pp |
July 2024 Housing Overview of the 50 Largest Metros
| Metro Area | Median Listing Price | Median Listing Price YoY | Median Listing Price per Sq. Ft. YoY | Median Listing Price vs July 2019 | Median Listing Price per Sq. Ft. vs 2019 |
| Atlanta-Sandy Springs-Alpharetta, Ga. | $424,500 | -2.4% | 1.3% | 30.6% | 52.4% |
| Austin-Round Rock-Georgetown, Texas | $539,530 | -6.2% | -3.4% | 48.2% | 60.3% |
| Baltimore-Columbia-Towson, Md. | $373,750 | -0.3% | 1.8% | 10.8% | 27.2% |
| Birmingham-Hoover, Ala. | $304,998 | 2.0% | 1.3% | 13.2% | 26.5% |
| Boston-Cambridge-Newton, Mass.-N.H. | $868,950 | 2.2% | 3.2% | 44.8% | 63.3% |
| Buffalo-Cheektowaga, N.Y. | $289,900 | 8.2% | 6.2% | 31.8% | 43.5% |
| Charlotte-Concord-Gastonia, N.C.-S.C. | $439,400 | -0.1% | 2.8% | 25.6% | 56.9% |
| Chicago-Naperville-Elgin, Ill.-Ind.-Wis. | $399,000 | 2.6% | 4.0% | 20.9% | 32.7% |
| Cincinnati, Ohio-Ky.-Ind. | $362,450 | -5.5% | 3.1% | 28.3% | 49.5% |
| Cleveland-Elyria, Ohio | $272,450 | 11.2% | 11.4% | 33.0% | 33.2% |
| Columbus, Ohio | $356,500 | -10.7% | 4.6% | 11.1% | 52.4% |
| Dallas-Fort Worth-Arlington, Texas | $450,000 | -4.3% | 0.2% | 26.7% | 44.2% |
| Denver-Aurora-Lakewood, Colo. | $627,450 | -7.0% | 2.2% | 25.5% | 46.7% |
| Detroit-Warren-Dearborn, Mich. | $279,950 | 4.1% | 5.2% | 7.7% | 30.0% |
| Hartford-East Hartford-Middletown, Conn. | $444,000 | 2.1% | 14.1% | 48.3% | 65.1% |
| Houston-The Woodlands-Sugar Land, Texas | $374,938 | -0.3% | -0.1% | 18.1% | 38.5% |
| Indianapolis-Carmel-Anderson, Ind. | $341,000 | -1.8% | 3.9% | 21.8% | 54.0% |
| Jacksonville, Fla. | $419,000 | -3.7% | -1.0% | 36.0% | 53.0% |
| Kansas City, Mo.-Kan. | $410,000 | -7.7% | -2.1% | 32.3% | 46.8% |
| Las Vegas-Henderson-Paradise, Nev. | $479,950 | 4.4% | 6.6% | 47.7% | 56.3% |
| Los Angeles-Long Beach-Anaheim, Calif. | $1,225,434 | 2.5% | 4.1% | 47.7% | 52.7% |
| Louisville/Jefferson County, Ky.-Ind. | $337,400 | 3.8% | 3.1% | 21.0% | 42.1% |
| Memphis, Tenn.-Miss.-Ark. | $347,175 | 6.8% | 1.2% | 50.2% | 62.9% |
| Miami-Fort Lauderdale-Pompano Beach, Fla. | $535,000 | -11.0% | -8.7% | 33.8% | 45.9% |
| Milwaukee-Waukesha, Wis. | $400,000 | 6.7% | 6.5% | 42.0% | 43.9% |
| Minneapolis-St. Paul-Bloomington, Minn.-Wis. | $456,495 | -1.0% | 2.2% | 29.7% | 35.3% |
| Nashville-Davidson-Murfreesboro-Franklin, Tenn. | $568,900 | -4.4% | 2.5% | 51.7% | 65.6% |
| New Orleans-Metairie, La. | $329,000 | -3.2% | -2.8% | 13.5% | 25.5% |
| New York-Newark-Jersey City, N.Y.-N.J.-Pa. | $777,000 | 5.4% | 7.2% | 35.1% | 78.3% |
| Oklahoma City, Okla. | $325,903 | -6.1% | 0.0% | 27.6% | 44.0% |
| Orlando-Kissimmee-Sanford, Fla. | $442,241 | -3.8% | -0.1% | 37.3% | 54.4% |
| Philadelphia-Camden-Wilmington, Pa.-N.J.-Del.-Md. | $389,950 | 11.4% | 7.9% | 36.3% | 53.1% |
| Phoenix-Mesa-Chandler, Ariz. | $528,450 | -2.1% | -0.7% | 38.1% | 54.0% |
| Pittsburgh, Pa. | $250,000 | 0.4% | 6.4% | 25.1% | 29.5% |
| Portland-Vancouver-Hillsboro, Ore.-Wash. | $625,000 | -2.3% | 1.6% | 31.6% | 41.1% |
| Providence-Warwick, R.I.-Mass. | $599,450 | 9.0% | 8.2% | 54.8% | 49.7% |
| Raleigh-Cary, N.C. | $464,012 | -1.3% | 2.6% | 23.7% | 52.1% |
| Richmond, Va. | $466,713 | 6.1% | 5.3% | 40.4% | 58.2% |
| Riverside-San Bernardino-Ontario, Calif. | $600,000 | 2.6% | 4.6% | 43.2% | 61.0% |
| Rochester, N.Y. | $299,900 | 15.6% | 15.2% | 30.7% | 43.6% |
| Sacramento-Roseville-Folsom, Calif. | $652,500 | -3.5% | 3.0% | 30.7% | 40.0% |
| San Antonio-New Braunfels, Texas | $349,898 | -4.1% | -2.9% | 19.2% | 38.1% |
| San Diego-Chula Vista-Carlsbad, Calif. | $1,038,750 | -5.4% | 3.7% | 45.9% | 64.8% |
| San Francisco-Oakland-Berkeley, Calif. | $973,875 | -11.5% | -6.5% | 5.1% | 25.9% |
| San Jose-Sunnyvale-Santa Clara, Calif. | $1,399,750 | -6.6% | -1.4% | 24.1% | 25.5% |
| Seattle-Tacoma-Bellevue, Wash. | $779,975 | -4.3% | -0.4% | 30.0% | 47.4% |
| St. Louis, Mo.-Ill. | $313,900 | 8.7% | 6.3% | 36.8% | 33.3% |
| Tampa-St. Petersburg-Clearwater, Fla. | $424,950 | -5.4% | -2.3% | 49.1% | 66.1% |
| Virginia Beach-Norfolk-Newport News, Va.-N.C. | $399,846 | 1.3% | 4.9% | 35.5% | 44.9% |
| Washington-Arlington-Alexandria, DC-Va.-Md.-W. Va. | $619,950 | -2.4% | 6.0% | 30.5% | 58.5% |
| Metro Area | Active Listing Count YoY | New Listing Count YoY | Median Days on Market | Median Days on Market Y-Y (Days) | Price– Reduced Share | Price-Reduced Share Y-Y (Percentage Points) |
| Atlanta-Sandy Springs-Alpharetta, Ga. | 56.8% | 2.3% | 41 | 1 | 24.4% | 7.9 pp |
| Austin-Round Rock-Georgetown, Texas | 30.7% | -11.0% | 58 | 8 | 31.4% | -1.3 pp |
| Baltimore-Columbia-Towson, Md. | 29.8% | 4.2% | 36 | -1 | 15.6% | 3.4 pp |
| Birmingham-Hoover, Ala. | 34.7% | -9.6% | 48 | 4 | 16.8% | 3.0 pp |
| Boston-Cambridge-Newton, Mass.-N.H. | 28.8% | 11.9% | 38 | 2 | 14.7% | 2.2 pp |
| Buffalo-Cheektowaga, N.Y. | 9.9% | 11.6% | 26 | -13 | 8.3% | 0.9 pp |
| Charlotte-Concord-Gastonia, N.C.-S.C. | 59.7% | 12.0% | 37 | -2 | 24.3% | 9.5 pp |
| Chicago-Naperville-Elgin, Ill.-Ind.-Wis. | 8.9% | -3.0% | 29 | -7 | 13.1% | 1.3 pp |
| Cincinnati, Ohio-Ky.-Ind. | 35.2% | 9.6% | 30 | -2 | 16.8% | 4.7 pp |
| Cleveland-Elyria, Ohio | 10.7% | 2.2% | 32 | -8 | 15.3% | 3.7 pp |
| Columbus, Ohio | 58.2% | 17.4% | 36 | 11 | 20.4% | 4.7 pp |
| Dallas-Fort Worth-Arlington, Texas | 51.5% | 3.3% | 43 | 6 | 30.1% | 5.7 pp |
| Denver-Aurora-Lakewood, Colo. | 75.1% | 10.5% | 39 | 8 | 32.4% | 8.9 pp |
| Detroit-Warren-Dearborn, Mich. | 10.8% | -5.9% | 32 | -1 | 14.2% | -0.9 pp |
| Hartford-East Hartford-Middletown, Conn. | 8.0% | -2.6% | 22 | -2 | 7.6% | 2.3 pp |
| Houston-The Woodlands-Sugar Land, Texas | 35.3% | -13.2% | 46 | 6 | 19.5% | 0.8 pp |
| Indianapolis-Carmel-Anderson, Ind. | 27.9% | -0.8% | 37 | -2 | 24.7% | 4.9 pp |
| Jacksonville, Fla. | 73.3% | 15.4% | 57 | 7 | 27.6% | 8.2 pp |
| Kansas City, Mo.-Kan. | 25.5% | 1.5% | 47 | -4 | 17.4% | 4.2 pp |
| Las Vegas-Henderson-Paradise, Nev. | -20.4% | 13.5% | 39 | -7 | 19.9% | 5.8 pp |
| Los Angeles-Long Beach-Anaheim, Calif. | 43.2% | 8.2% | 39 | -3 | 13.8% | 4.3 pp |
| Louisville/Jefferson County, Ky.-Ind. | 33.3% | -1.0% | 33 | 2 | 20.3% | 5.3 pp |
| Memphis, Tenn.-Miss.-Ark. | 49.0% | -2.6% | 50 | 6 | 25.2% | 6.0 pp |
| Miami-Fort Lauderdale-Pompano Beach, Fla. | 71.6% | 5.2% | 72 | 8 | 17.5% | 5.2 pp |
| Milwaukee-Waukesha, Wis. | 5.0% | 15.2% | 27 | -2 | 11.6% | 1.5 pp |
| Minneapolis-St. Paul-Bloomington, Minn.-Wis. | 21.9% | 1.4% | 32 | -4 | 15.2% | 1.7 pp |
| Nashville-Davidson-Murfreesboro-Franklin, Tenn. | 26.5% | -1.1% | 35 | 2 | 25.1% | 3.4 pp |
| New Orleans-Metairie, La. | 29.6% | -1.4% | 66 | 6 | 20.1% | 0.5 pp |
| New York-Newark-Jersey City, N.Y.-N.J.-Pa. | 3.2% | 2.9% | 50 | -4 | 8.6% | 0.7 pp |
| Oklahoma City, Okla. | 35.7% | 15.7% | 44 | 1 | 22.6% | 3.1 pp |
| Orlando-Kissimmee-Sanford, Fla. | 78.7% | 7.4% | 58 | 12 | 24.4% | 6.7 pp |
| Philadelphia-Camden-Wilmington, Pa.-N.J.-Del.-Md. | 13.3% | -1.8% | 41 | -4 | 13.5% | 1.8 pp |
| Phoenix-Mesa-Chandler, Ariz. | 60.9% | 2.3% | 51 | 6 | 28.0% | 9.4 pp |
| Pittsburgh, Pa. | 20.4% | -0.6% | 44 | -3 | 18.6% | 3.7 pp |
| Portland-Vancouver-Hillsboro, Ore.-Wash. | 29.8% | 8.1% | 45 | 7 | 22.0% | 4.0 pp |
| Providence-Warwick, R.I.-Mass. | 31.1% | 13.8% | 27 | -9 | 10.1% | 3.2 pp |
| Raleigh-Cary, N.C. | 50.7% | 5.6% | 38 | -4 | 20.1% | 7.6 pp |
| Richmond, Va. | 39.3% | 9.8% | 37 | -6 | 14.1% | 6.3 pp |
| Riverside-San Bernardino-Ontario, Calif. | 40.8% | -0.9% | 49 | 4 | 16.7% | 3.8 pp |
| Rochester, N.Y. | 8.2% | -5.5% | 21 | 6 | 4.2% | -4.4 pp |
| Sacramento-Roseville-Folsom, Calif. | 48.1% | -0.3% | 37 | 1 | 20.8% | 6.7 pp |
| San Antonio-New Braunfels, Texas | 45.4% | 1.2% | 53 | 3 | 27.4% | 3.1 pp |
| San Diego-Chula Vista-Carlsbad, Calif. | 77.7% | 14.5% | 33 | 2 | 19.1% | 8.6 pp |
| San Francisco-Oakland-Berkeley, Calif. | 36.6% | 5.2% | 36 | 2 | 13.0% | 2.5 pp |
| San Jose-Sunnyvale-Santa Clara, Calif. | 60.7% | 30.8% | 26 | -4 | 11.3% | 2.4 pp |
| Seattle-Tacoma-Bellevue, Wash. | 73.5% | 37.3% | 31 | -3 | 17.4% | 4.0 pp |
| St. Louis, Mo.-Ill. | 15.2% | 2.4% | 36 | -2 | 14.2% | 3.1 pp |
| Tampa-St. Petersburg-Clearwater, Fla. | 94.9% | 5.9% | 59 | 13 | 30.6% | 9.7 pp |
| Virginia Beach-Norfolk-Newport News, Va.-N.C. | 33.2% | 0.5% | 34 | 1 | 20.1% | 7.0 pp |
| Washington-Arlington-Alexandria, DC-Va.-Md.-W. Va. | 24.1% | -4.1% | 32 | -3 | 13.4% | 2.5 pp |
Methodology
Realtor.com housing data as of July 2024. Listings include the active inventory of existing single-family homes and condos/townhomes/row homes/co-ops for the given level of geography on Realtor.com; new construction is excluded unless listed via an MLS that provides listing data to Realtor.com. Realtor.com data history goes back to July 2016. The 50 largest U.S. metropolitan areas as defined by the Office of Management and Budget (OMB-202003).
San Diego County Home Prices Soften in July - Times of San Diego

Home prices in San Diego County softened in July compared to the previous month’s sales activity, the California Association of Realtors announced Tuesday.
July’s sales pace statewide rose 3.6% from the revised 270,200 homes sold in June and were up 4.1% from a year ago, when a revised 268,840 homes were sold on an annualized basis. The sales pace has remained below the 300,000- threshold for 22 consecutive months, and year-to-date home sales edged up 0.2% from the first seven months of 2023.
The statewide median price slipped in July for the second month in a row, after setting a record high in May. July’s median price dipped 1.6% from $900,720 in June to $886,560 in July. California’s median home price was 6.5% higher than the $832,530 recorded in July 2023. The year-over-year gain was the 13th straight month of annual price increases, albeit the smallest since January, according to CAR.
Home prices could soften further in coming months but should continue to register moderate year-over-year growth for the rest of the year, the association said.
“California’s housing market kicked off the second half of the year with a moderate increase in home sales in July as interest rates continued their downward trend,” CAR President Melanie Barker said in a statement. “Despite transitioning into the off-season, the market should remain vibrant in the coming months if the availability of homes for sale continues to improve, and mortgage rates moderate further in the third and fourth quarters.”
The median price in San Diego County was lower in July at $1.02 million, compared to the previous month’s $1.05 million, a 5.3% increase from July of last year, but a 3.2% decrease from June.
In Southern California overall, the lowest median price in July was Imperial County’s $385,000, showing no change from the previous month’s home price.
The median number of days it took to sell a San Diego County single- family home was 16 days in July, four days more than July of last year.
— City News Service
Rocket Homes Report
https://www.rockethomes.com/real-estate-trends/ca/san-diego-county
Summary: The San Diego County housing inventory by bedroom type for July 2024 compared to the previous month: The inventory of 1 bedroom homes increased by 8.7%, 2 bedroom homes increased by 9.3%, 3 bedroom homes increased by 3.6%, 4 bedroom homes increased by 9%, and 5+ bedroom homes increased by 4.3%.
Number of Homes Sold
| Jun 2024 | Jul 2024 | CHANGE |
|---|---|---|
| 1,894 | 1,988 | +5.0% |
Asking Price vs. Sold Price
771 Homes Were Sold
Under Asking
351 Homes Were Sold
At Asking
866 Homes Were Sold Over Asking
44%39%18%
Summary: A total of 1,988 homes were sold or pending in San Diego County in July 2024, up by 5.0% month-over-month. Of the 1,988 sold homes, 39% were sold under asking, 18% were sold at asking, and 44% were sold over asking.
Days on Market for San Diego County, CA
How long does it take to sell a home in San Diego County, CA?
Average Sale Time
| Jul 2023 | Jul 2024 | CHANGE |
|---|---|---|
| 17 Days | 22 Days | +26.0% |
Summary: Homes in San Diego County had an average of 22 days on market in Jul 2024, up by 26% compared to last year.
Breakdown of Home Sale Times
1,538 Homes Were Sold
Under 30 Days
391 Homes Were Sold
In 30 - 90 Days
59 Homes Were Sold Over 90 Days
77%20%
Summary: During July 2024, 1988 homes were sold in San Diego County; 77% of homes were sold within 30 days, 20% of homes were sold within 30 to 90 days, and 3% of homes were sold over 90 days.
Comments
Post a Comment